


TL;DR
The Mac equivalent of Task Manager is called Activity Monitor. Here is how to open it:
- Press Command ⌘ + Space to open Spotlight.
- Type Activity Monitor.
- Click Activity Monitor from the search results to open it.
Tried and Tested ✅: The methods and steps mentioned in this article have been tried and tested firsthand by Ojash Yadav on his MacBook Pro M3 and rechecked for errors on Hashir’s MacBook Air M2.
If you want to check what’s going on inside your Mac, Activity Monitor is the tool you need. I’ve used it to understand my Mac’s performance, and in this post, I’ll show you how to use it to get all the key info about your system.
What Is the Mac Task Manager Equivalent?
The Mac equivalent of Task Manager is called Activity Monitor. It shows you all the apps and processes running on your Mac, just like Task Manager does on a Windows computer. You can use it to:
- See which apps use the most CPU, memory, or energy.
- Close apps or processes that aren’t responding.
- Monitor network and disk activity.
How to Open the Task Manager on Mac
Why You Can Trust MacBook Journal ![]() We always conduct first-hand research and verify every method or solution we present, ensuring you receive reliable and effective advice. Learn more about our process.
We always conduct first-hand research and verify every method or solution we present, ensuring you receive reliable and effective advice. Learn more about our process.
Below, I’ve shared all the methods you can use to open Activity Monitor on your Mac.
1. From Spotlight
To open the Activity Monitor from Spotlight, follow these steps:
- Press the Command ⌘ + Space keys or click the magnifying icon in the menu bar to open Spotlight Search.

- In the search bar that appears on your screen, type Activity Monitor.
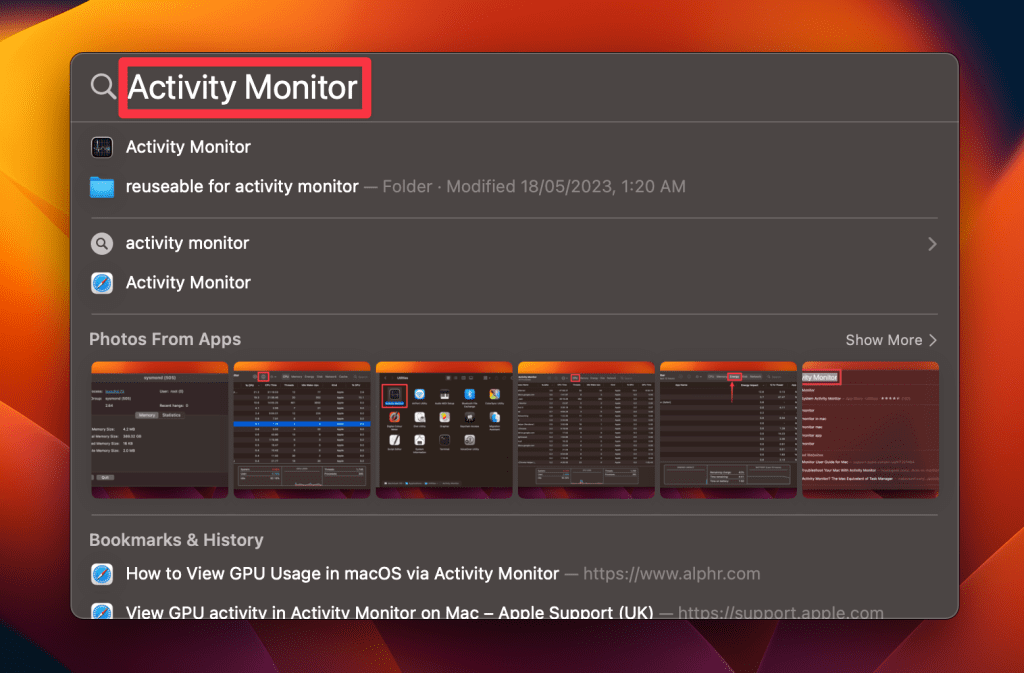
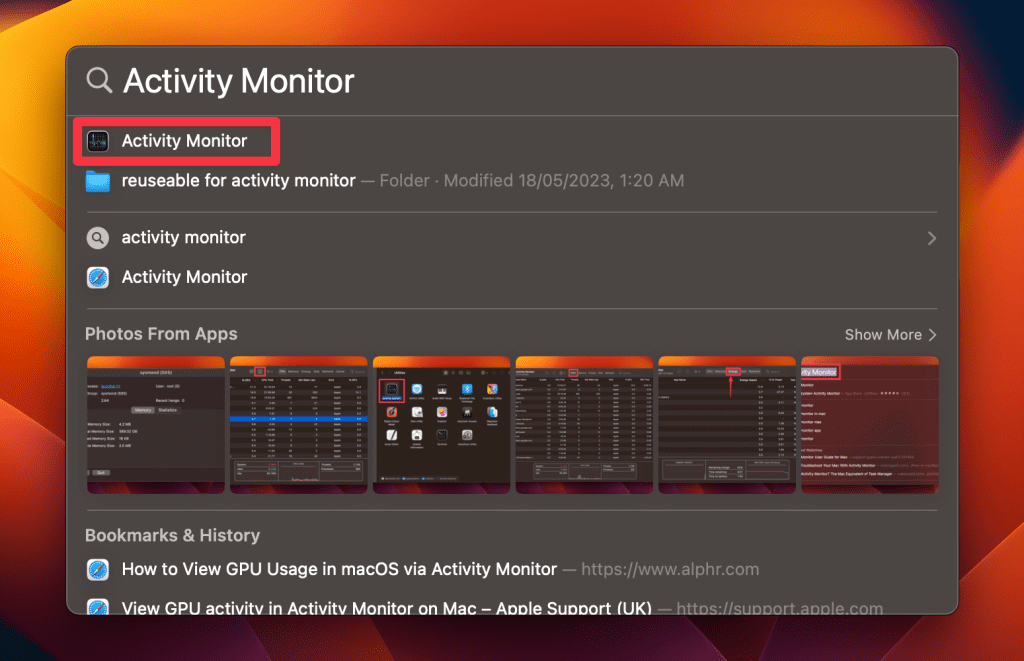
- As you type, Spotlight will start displaying search results. Look for the Activity Monitor application in the results list.
- Once you see the Activity Monitor app, click to open the utility.
The Activity Monitor will launch, providing you with detailed information about the processes and resource usage on your Mac.
2. From Finder
To open the Activity Monitor from Finder, you can follow these steps:
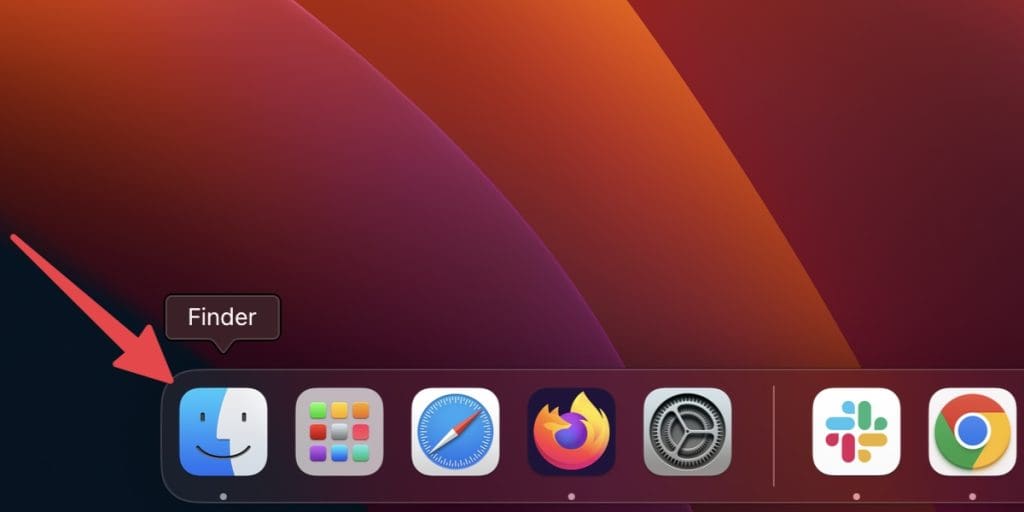
- Open a new Finder window by clicking the Finder icon in the Dock.
- Click Applications in the left sidebar.

- Scroll down and find the Utilities folder.
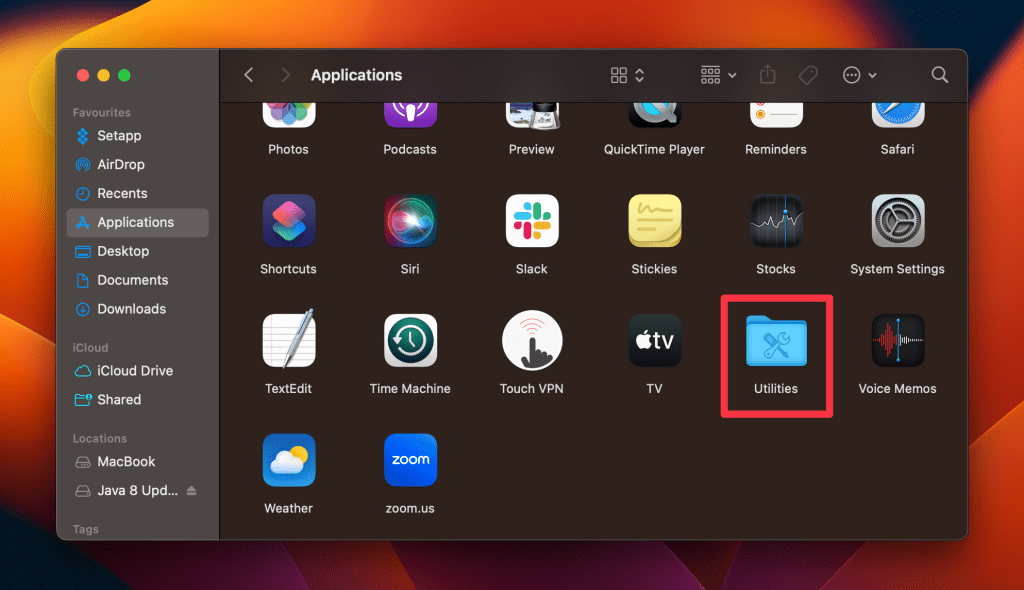
- Navigate through the Utilities folder to find the Activity Monitor application.
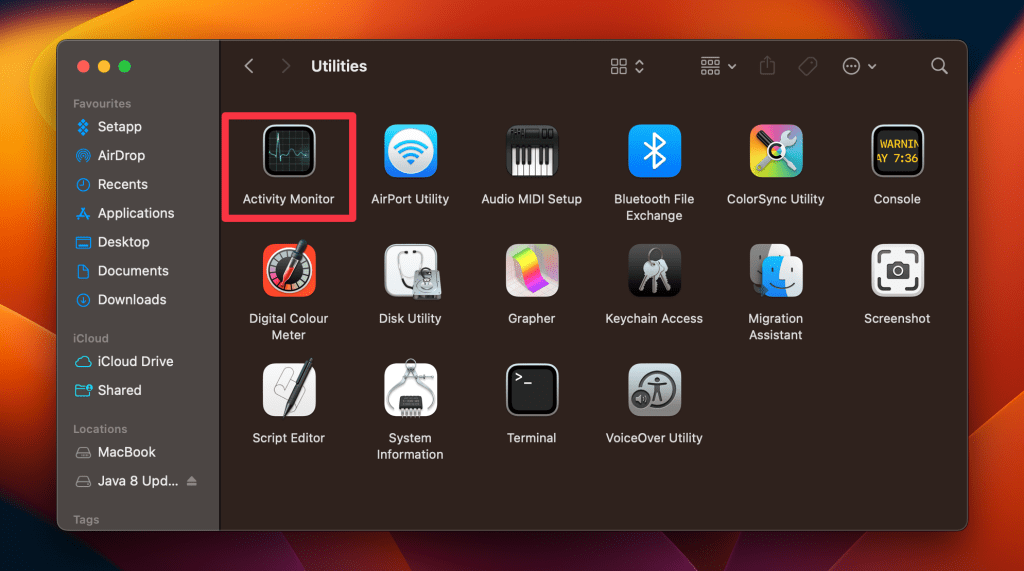
Once you find the Activity Monitor application, double-click to open the utility.
3. From Launchpad
To open the Activity Monitor from Launchpad, you can follow these steps:
- Click the Launchpad icon in the Dock.
- The Launchpad will open, displaying a grid of application icons and a search bar on the top.
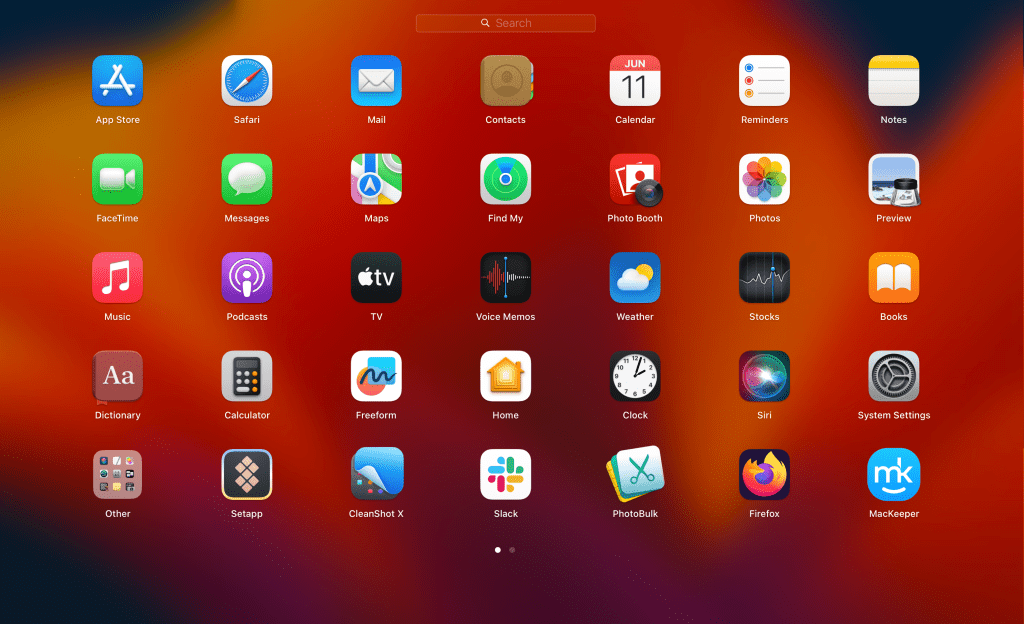
- Type Activity Monitor in the search bar and it will display the Activity Monitor app icon.
- Click the Activity Monitor icon to launch the utility.
This will launch the Activity Monitor app on your Mac.
How to Use Activity Monitor on Mac
Using the Activity Monitor is easy but you have to familiarize yourself with the interface and how to use its indicators. Here’s a breakdown:
1. Check CPU Usage on Mac
To check CPU usage on Mac using Activity Monitor, follow these steps:
- Open Activity Monitor. You can find it in the Applications folder, under Utilities, or use Spotlight Search (press Command ⌘ + Space and type Activity Monitor).
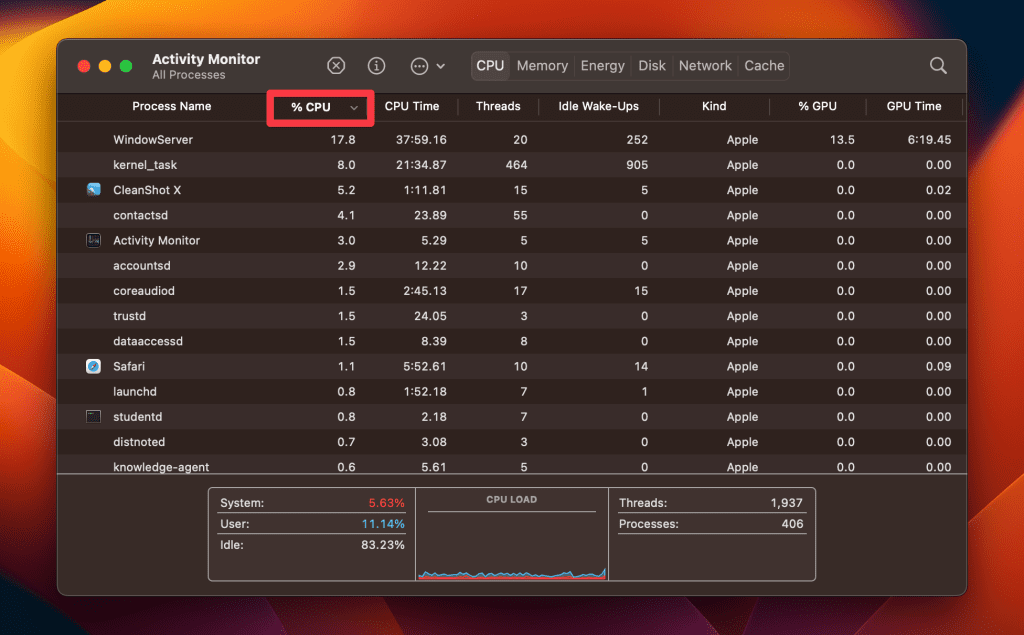
- Once Activity Monitor is open, click the CPU tab at the top of the window. This will show you the CPU-related information.
- In the CPU pane, you’ll see a list of processes and applications, with their corresponding CPU usage percentages. The higher the percentage, the more CPU resources that process or application is consuming.

- To sort the processes by CPU usage, click on the % CPU column header. This will arrange the list in descending order, making it easier to identify which processes are using the most CPU.
2. Check RAM Usage on Mac
To check RAM usage on Mac using Activity Monitor, follow these steps:
- Open Activity Monitor by going to Finder > Applications > Utilities.
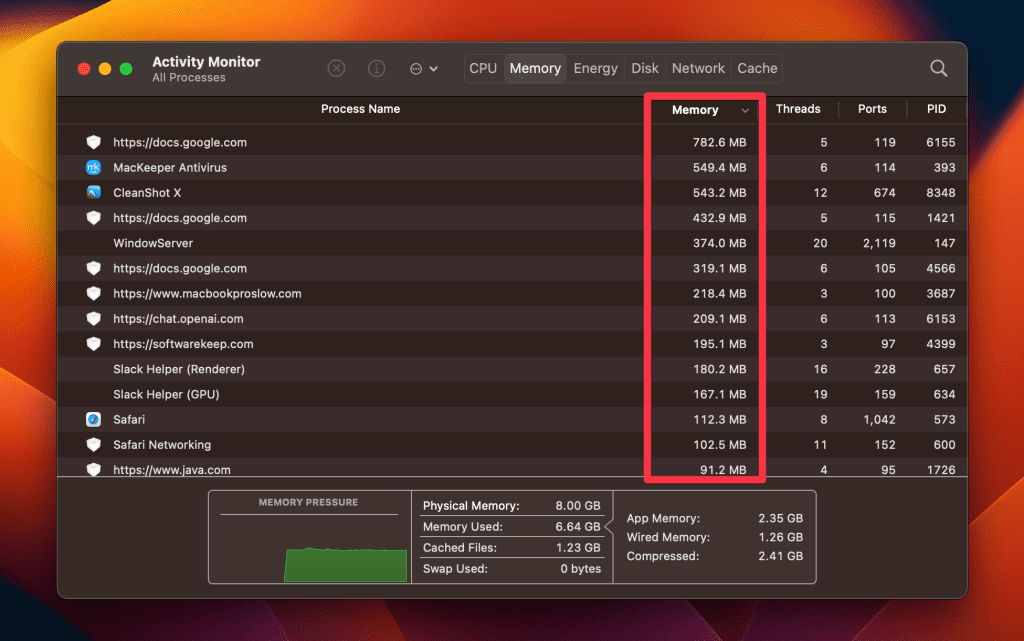
- Once the Activity Monitor is open, click the Memory tab at the top of the window. This will show you the RAM-related information.
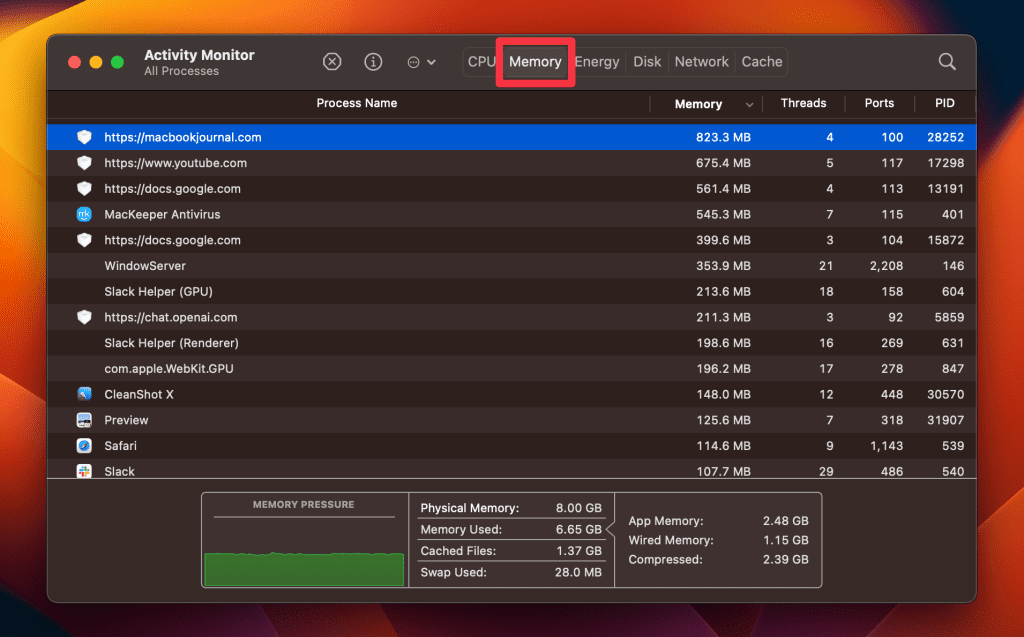
- You’ll find a list of processes and applications, along with their corresponding memory usage. The Memory column displays the amount of RAM being used by each process.
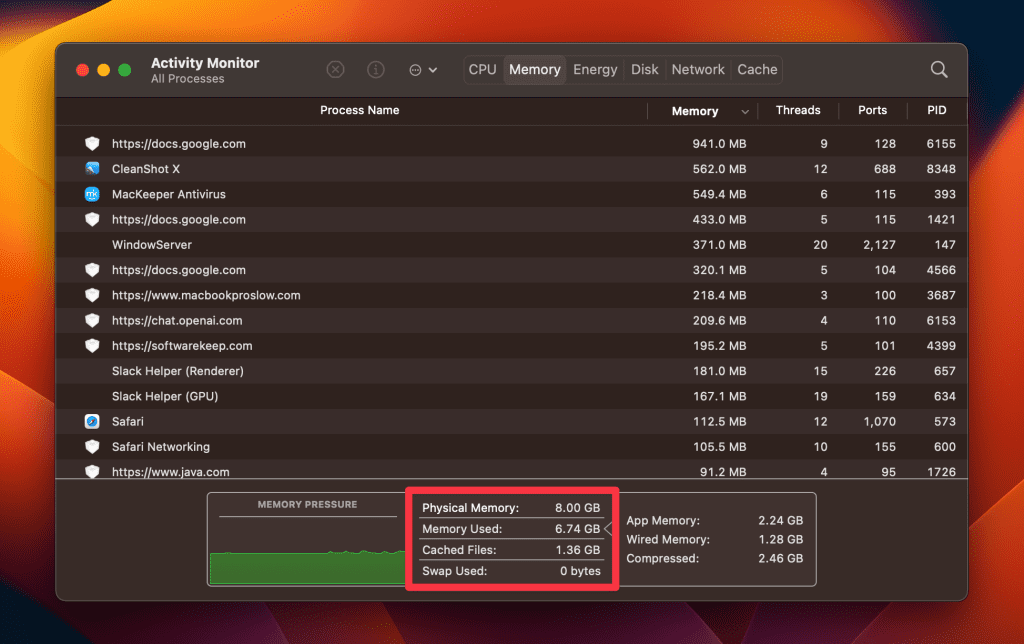
- At the bottom of the RAM pane, you’ll see a summary of your Mac’s total physical memory, memory used, cached files, and swap used.
3. Check Energy Use on Mac
To check energy use on Mac using Activity Monitor, follow these steps:
- Open Activity Monitor by going to Finder > Applications > Utilities.
- Once the Activity Monitor is open, click the Energy tab at the top of the window. This will display the energy-related information.

- In the Energy pane, you’ll see a list of processes and applications, along with their corresponding energy impact. The higher the energy impact value, the more power the application is consuming.
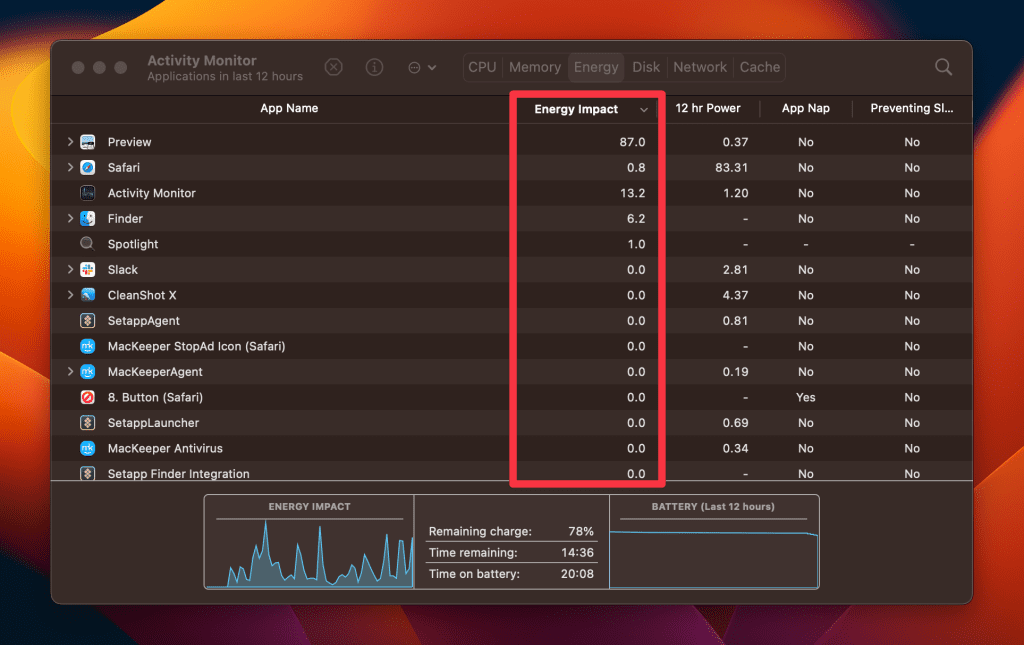
Additionally, you can observe other metrics such as App Nap, 12 hr Power, and Preventing Sleep in the Energy pane to gain further insights into the energy usage of specific applications.
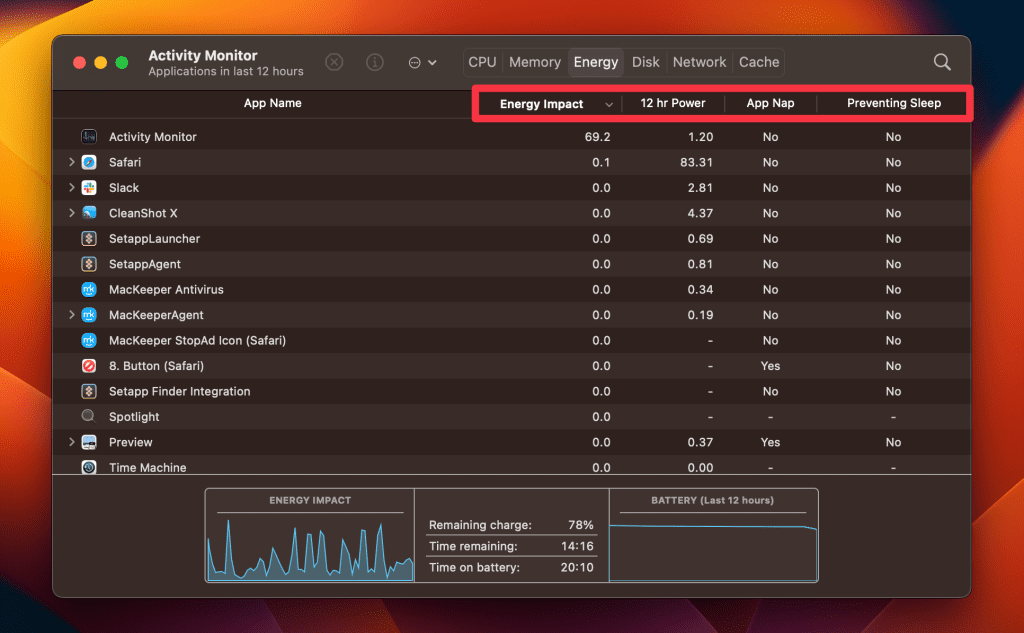
- App Nap: Shows if an app is saving energy by reducing power when not active or visible.
- 12 hr Power: Displays the average energy impact of an app over the past 12 hours.
- Preventing Sleep: Indicates if an app is stopping your Mac from going to sleep, increasing energy use.
4. Check Disk Activity on Mac
To check disk activity on Mac using Activity Monitor, follow these steps:
- Open Activity Monitor by typing Activity Monitor in the Spotlight Search. You can open Spotlight by pressing Command ⌘ + Space.
- Once the Activity Monitor is open, click the Disk tab at the top of the window. This will display the disk-related information.
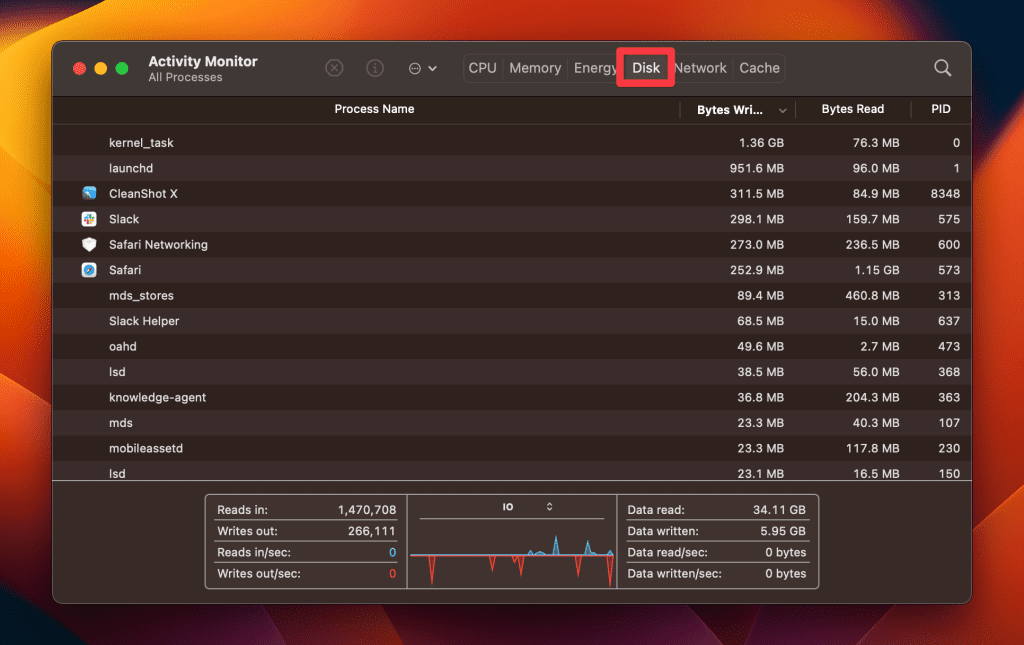
- In the Disk pane, you’ll see a list of processes and applications, with their corresponding read and write data rates. The Bytes Written and Bytes Read columns show the amount of data being read from and written to the disk by each process.
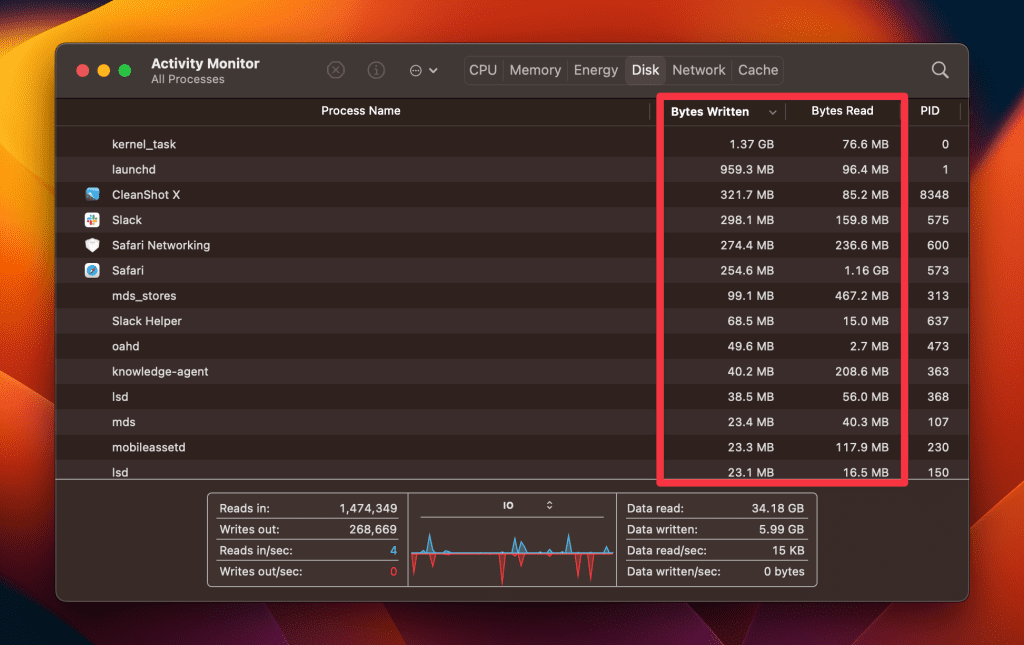
- You can also check the average disk usage at the bottom of the Disk pane in Data read/sec and Data written/sec options.

5. Check Network Activity on Mac
To check network activity on Mac using Activity Monitor, follow these steps:
- Open Activity Monitor using Spotlight Search. Press Command ⌘ + Space and type Activity Monitor.
- Once the Activity Monitor is open, click the Network tab at the top of the window. This will display the network-related information.
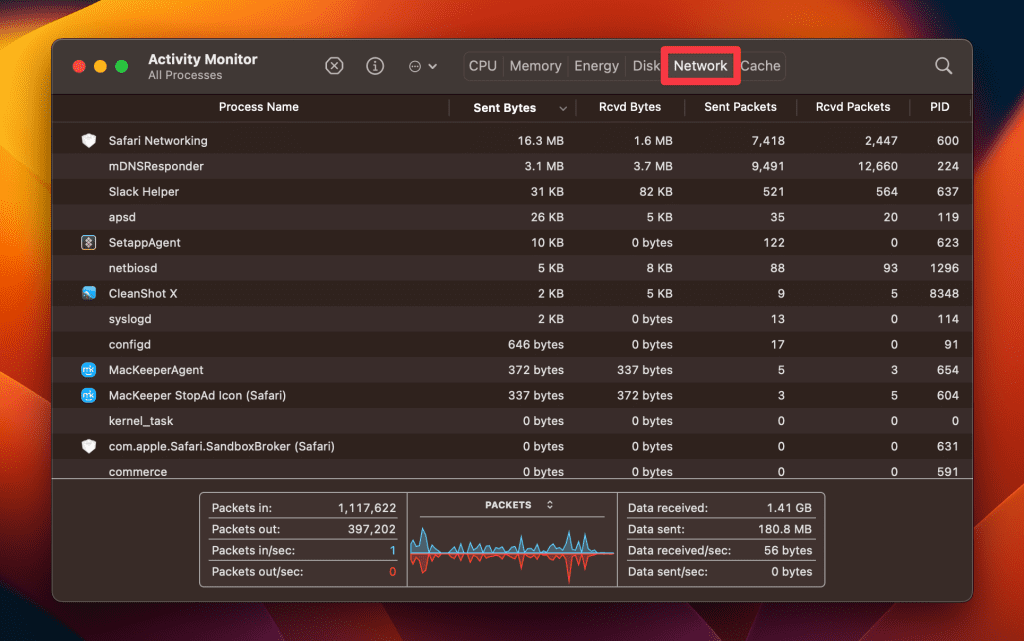
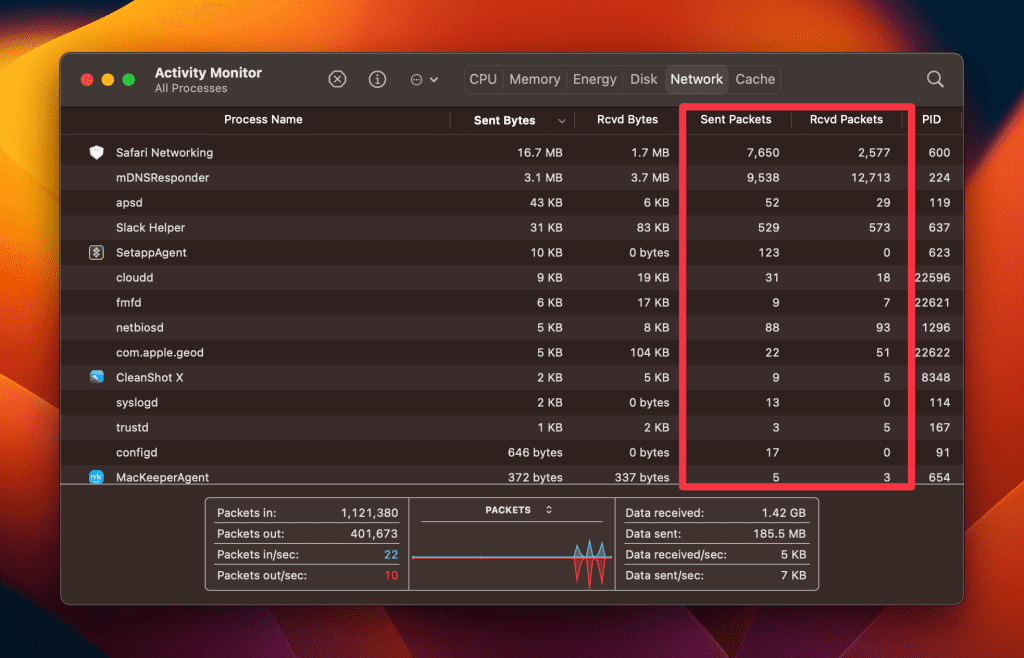
- In the Network pane, you’ll see a list of processes and applications, along with their corresponding network usage. The Sent Bytes and Rcvd Bytes columns show the amount of data being sent and received by each process.

You can also use the Network pane to monitor other network-related information such as the Sent Packets and Rcvd Packets column, which displays the number of packets being sent and received by each process.
What Is the Control-Alt-Delete Shortcut for Mac?
On a Mac, the equivalent to the Windows Control-Alt-Delete shortcut is Command ⌘ + Option ⌥ + Escape. However, this keyboard shortcut doesn’t open the Activity Monitor. Instead, it opens the Force Quit Applications window, which is like a mini version of Activity Monitor.
Here’s how to force quit an app using Force Quit Applications on Mac:
- Press the Command ⌘ + Option ⌥ + Escape shortcut or click the Apple icon and select Force Quit.
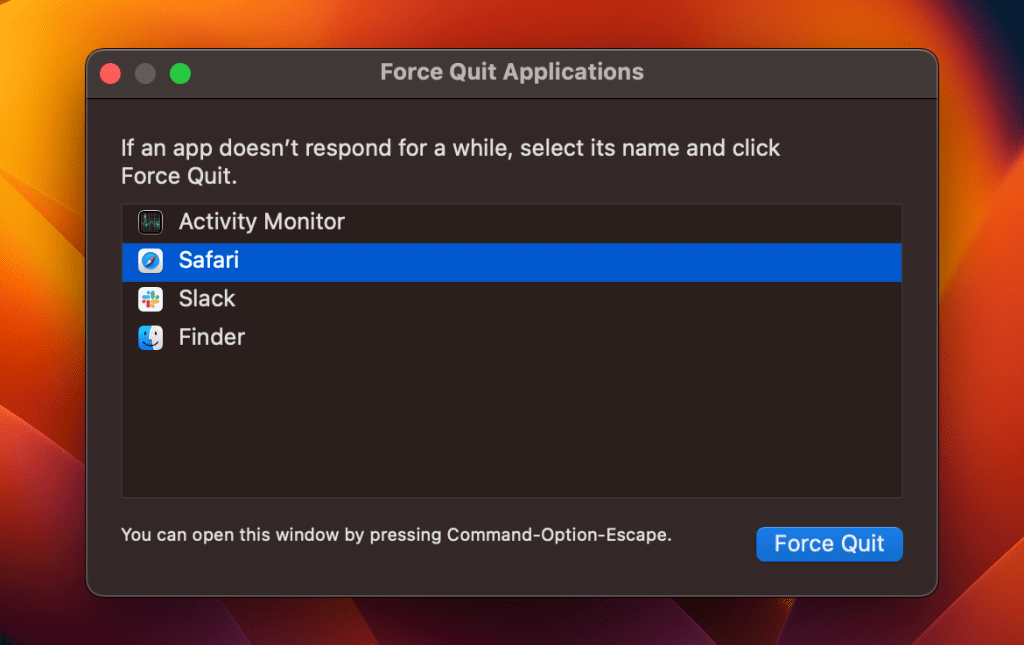
- The Force Quit Applications window will appear, displaying a list of currently running applications.

- Find the app you want to force quit from the list. If the application is unresponsive or frozen, its name may be highlighted in red.
- Select the application by clicking it once. Click the Force Quit button in the bottom-right corner of the window.
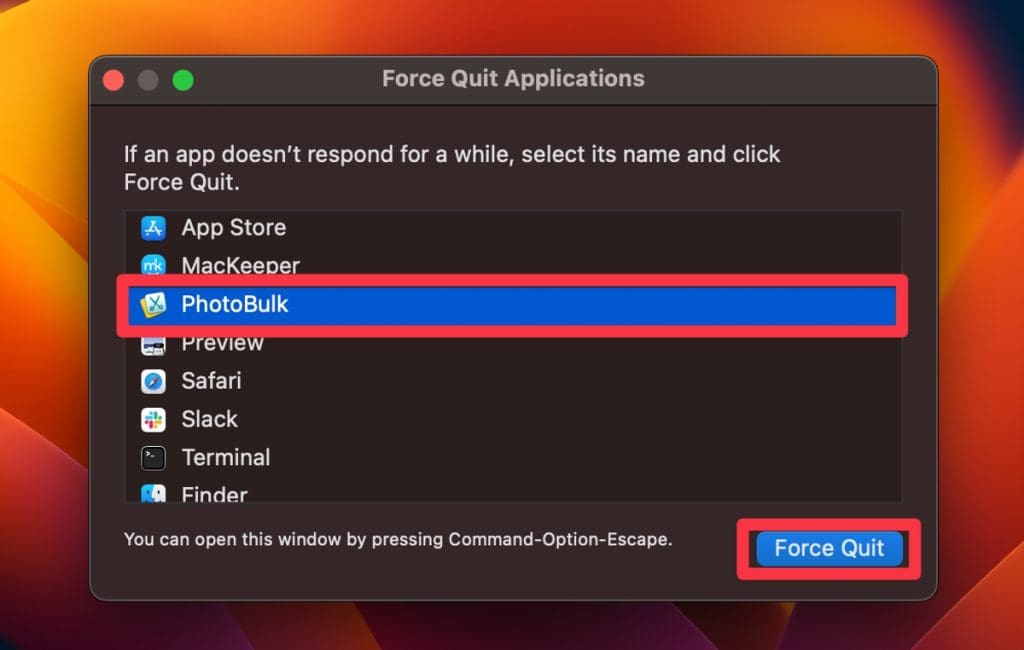
- A confirmation dialog will appear, asking if you want to force quit the selected application. Click Force Quit to proceed.

- The application will be forcefully terminated, closing all its associated processes.
Please note that force quitting an application may result in any unsaved data being lost, so it’s recommended to save your work before proceeding with force quitting.
Use Mac Task Manager Equivalent Like a Pro
The Activity Monitor is a powerful tool for managing and understanding your Mac’s performance. Activity Monitor provides a comprehensive view of your Mac’s performance, from monitoring CPU and memory usage to tracking energy consumption.
If you need more help, here are some more tips for you:
- Use Activity Monitor to check your Mac’s temperature to keep things running smoothly.
- You can also monitor Mac CPU, GPU, and RAM usage using the Activity Monitor.
- Activity Monitor can help you free up RAM on your Mac and optimize your system performance.